Market share is the most cited, least understood metric for most HVAC distributors. With economic uncertainty hanging over 2026, sharper distribution planning is essential. Here is how to ground your growth targets in reality and avoid the blind spots competitors may be leaving wide open.

Why Market Share Matters in 2026
This article kicks off a series we will be publishing over the next few weeks on planning and budgeting for 2026. Each piece will explore a different part of the puzzle, from market sizing to scenario planning to resource allocation.
Every fall, HVACR distribution leadership teams pull together budgets, growth targets, and strategy decks. But one question often goes unanswered: what is our true market share, and how do we calculate it in a way that informs 2026 planning?
In HVACR, the term gets tossed around in planning meetings but often isn’t calculated with discipline. Without it, growth targets are aspirations, not strategy.
The urgency is higher heading into 2026. Forecasts remain mixed. Some observers expect a shallow, uneven slowdown that varies by region and segment, while financing costs remain elevated. Whether the pie shrinks or stays flat, knowing the size of your slice is the only way to tell if you are holding ground or losing it.
Defining Market Share: Pick a Lens, Stick With It
Market share is not one number. It is a lens. It can be measured by:
- Revenue: your sales ÷ total category sales.
- Volume: critical in commodity lines such as ductwork, conduit, or fasteners.
- Geography: national, regional, or branch-level.
- Segment: contractor, OEM, or institutional customers.
Guardrails on the math: Track share by revenue and review your sales data by units, because they tell different stories. Normalize for inflationary effects such as supply chain spikes, tariffs, and commodity swings, so “growth” is not just higher prices. When possible, compare like for like product mix, i.e., SEER rating, tonnage, or SKU families, to avoid false positives. The key is consistency. Using the same model over time helps identify trends and opportunities. In an uncertain economy, fuzzy definitions create false signals. What looks like losing share may simply be the market contracting.
Inputs You Need (and They Don’t Have to Be Perfect)
Perfect data is a myth. Directional clarity, and a consistent method of calculation, is what matters. Sometimes this is more art than science.
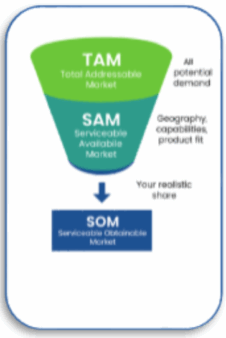
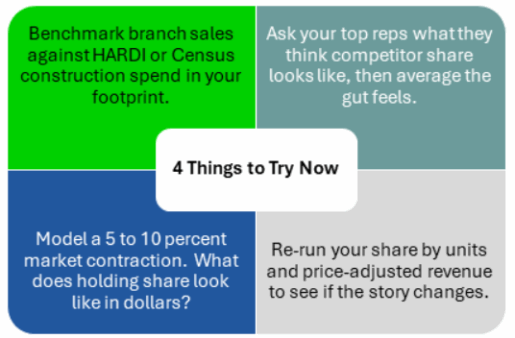
- TAM (Total Addressable Market): independent market sizing resources such as HARDI, DISC Corp, and U.S. Census construction spend, Dodge market reports,. You can also crowdsource input from your team, including reps and manufacturers.
For HVACR distributors, TAM and SAM sizing provides the denominator for calculating market share and comparing growth potential across branches.
- SAM (Serviceable Available Market): the portion of the total market you could realistically serve based on geography, capabilities, and product fit.
- SOM (Serviceable Obtainable Market): the share of the market you can realistically win, based on current capacity, competitive presence, and customer preferences. It is the bite of the pie you can actually take, not just the slice you could serve.
- Customer data: what is in your ERP or CRM, such as branch sales, customer mix, and product categories.
- Competitive intelligence: who has branch coverage in your footprint, and where they are gaining or losing.
If your sales are flat but the overall market in your state drops 10 percent, you actually grew share. That distinction is critical when deciding whether to trim, hold, or invest.
Methods to Calculate Market Share
- Top-down: start with published market size such as DISC reports and back into your share.
- Bottom-up: use your own sales and triangulate local market size from competitor activity.
- Hybrid: blend both, then pressure-test assumptions.
Example: A $10M distributor in a $100M regional HVAC market equals 10 percent share. But if 40 percent of that market is OEM business you do not serve, your true share is closer to 17 percent of the business you can win.
Also note that the equipment lines you represent can amplify or cap your obtainable share. Contractor preferences are real and sticky. Converting them is usually a multi-year effort and should be modeled into your serviceable obtainable market (SOM).
Turning Market Share Into a Planning Lever
Market share is more than a scoreboard. It is a planning tool.
- At 8 percent in a fragmented region, you have headroom.
- At 60 percent in a concentrated product line such as specialty fittings, growth has to come from adjacency.
- In downturns, shifts in share tend to happen faster. Competitors cut back, contractors look for reliability, and winners gain ground.
Planning without share math is like budgeting without a balance sheet.
The Competitive Blind Spot
Most competitors reference market share but treat it as a guess. They will say, “We are probably 15 to 20 percent in that category,” without evidence. This could be a blind spot, and an opening for leaders who do the math.
What Our Journey Has Looked Like
We have guided dozens of distribution teams in multiple industries through this challenge. The data may be messy, the competitive landscape is patchy, and “gut feel” often drowns out the math.
Over time we’ve built a repeatable methodology that blends three inputs: top-down market estimates, bottom-up customer sales, and competitive intelligence. The output is not a perfect number. It is a defensible range leadership can use to anchor planning.
That methodology has become a recurring engagement for Channel Marketing Group (CMG). We package it in simple one-page visuals and branch-level workbooks so teams can stress-test assumptions and translate analysis into action. The value is not just the math. It is having a consistent, transparent framework that aligns the organization on what growth really means.
CMG’s Distribution Market Share Process at a Glance:
- Scope and lens: Define geography, segments, and lines.
- Assemble inputs: TAM sources, ERP or CRM extracts, and competitor maps.
- Normalize: Clean data, consider key categories, etc.
- Model: Run top-down, bottom-up, and hybrid to produce a range.
- Stress-test: Use plus or minus five to ten percent scenarios and mix shifts.
- Translate to action: Branch targets, one-pager visuals, and an assumptions register for 2026 reviews.
Call to Action: Before You Finalize 2026 Plans
If we slip into recession, the pie will shrink. The only question is: will your slice hold steady, grow, or get eaten away?
Run at least one distributor market share calculation before your 2026 planning meeting. Even rough math will sharpen the conversation, improve your 2026 distribution planning, and may surface opportunities competitors overlook.
Next up in this series: sizing your market, and how to frame TAM, SAM, and SOM even when the data is fuzzy.
How do you and your team calculate market share today: consistently, or case by case? Share your approach in the comments. If you want a second set of eyes, or a structured way to make the math repeatable, drop me a line at clabow@channelmkt.com. This conversation will also continue on LinkedIn, so join us there if you want to compare notes.

