Market share math only works if you define the market you are measuring against. TAM, SAM, and SOM are the three lenses that turn gut feel into something you can plan with. For HVACR distributors, iffy-definitions create false signals that can derail planning. This article breaks down how HVACR distributors calculate market share using TAM, SAM, and SOM.
Market share math only works if you define the denominator. TAM, SAM, and SOM are the lenses that make planning real.
Why TAM, SAM, and SOM Matter for HVACR Distributors in 2026
Budgets and plans live or die on assumptions. If your denominator is the whole market, you may think you have a tiny share. Narrow it to the geography, market segments, or perhaps the lines you actually serve, and the story flips. In a year where growth may be uncertain, clarity on the market you can serve is critical for HVACR planning in 2026.
Budgets and plans live or die on assumptions. If your denominator is the whole market, you may think you have a tiny share. Narrow it to the lines you actually serve, and the story flips.
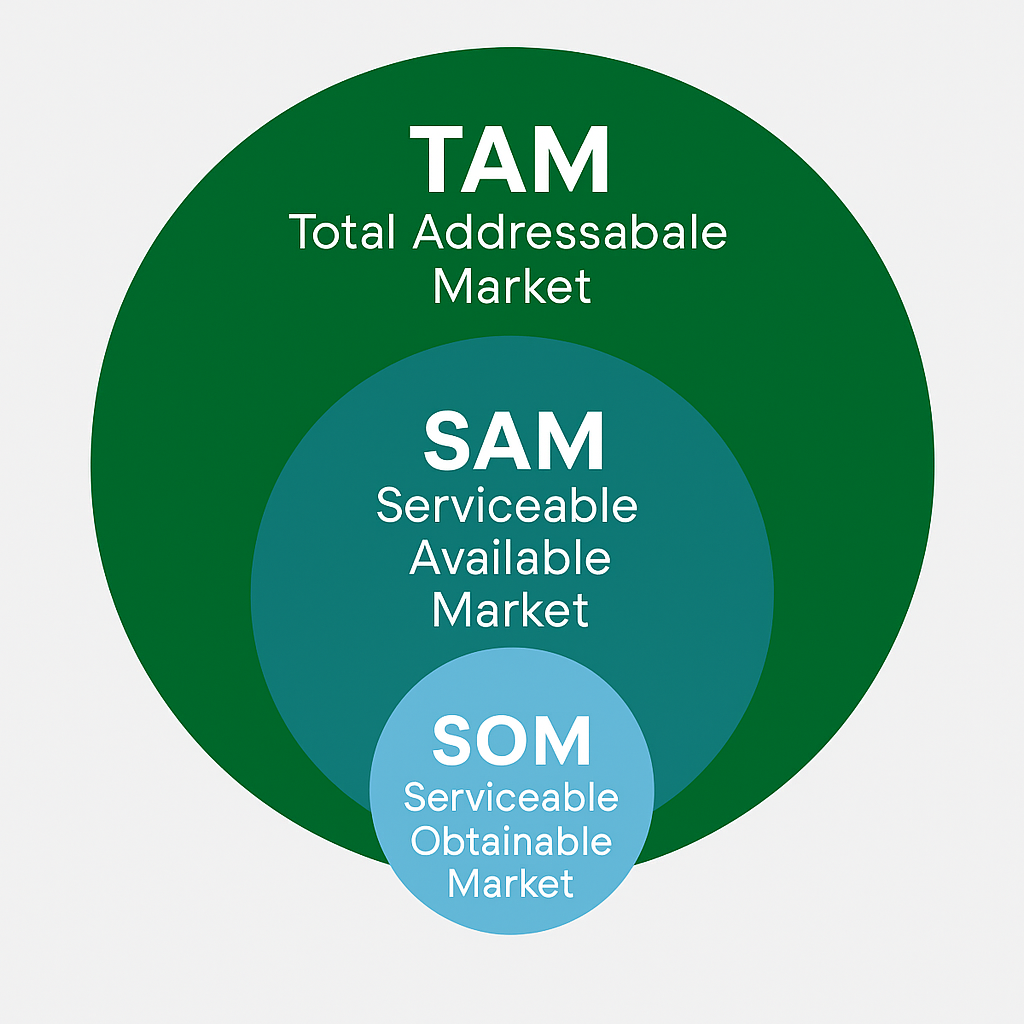
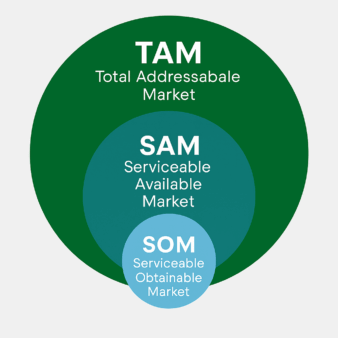
TAM: The Total Pie
- Total Addressable Market = all potential demand in the category.
- Market-size data sources could include firms like HARDI, DISC Corp, MDM Analytics, AHRI, U.S. Census construction spend, and Dodge reports.
- Useful for sizing long-term opportunity planning, investor decks, etc.
- Not actionable for day-to-day planning.
SAM: The Slice You Could Serve
- Serviceable Available Market = the portion of TAM that fits your geography, market segment, capabilities, and product portfolio.
- Example: a Cleveland, Ohio based residentially oriented distributor with 3 locations rarely could sell into California and a company without chillers in its line-up cannot sell into the chiller market.
- This is the realistic playing field for most distributors.
SOM: The Bite You Can Realistically Win
- Serviceable Obtainable Market = what you can actually capture based on capacity, competitive coverage, and customer preferences.
- Example: SOM is the denominator for true distributor market share calculation.
SOM is the denominator for true distributor market share calculation. Without it, planning becomes guesswork.
Why Consistency in Market Sizing Beats Perfection for Distributors
Market sizing is never perfect. But being consistent in your definitions lets you measure changes year over year.
Market sizing is never perfect, but consistency beats precision. Directional truth is more valuable than false accuracy.
- Using the same TAM, SAM, and SOM definitions each cycle creates a repeatable distribution strategy framework
- Capture assumptions in a log so that you can review in subsequent planning sessions.
- Track directional shifts rather than chasing false precision.
Where CMG Fits
We have helped build frameworks for market sizing for distributors, packaged into one-pagers and branch-level planning packages. These tools enable leadership teams to stress-test growth assumptions and spot headroom.
Call to Action
As you sharpen budgets, make sure your team is aligned on the denominator. That is the only way to understand HVACR distributor market share in 2026. If one manager uses TAM, another uses SAM, and a third uses SOM, the numbers will never line up.
Next in the series: Scenario planning, what happens if the market grows, stalls, or contracts.
Three Things to Do Now
- Write down your working definitions of TAM, SAM, and SOM for your business.
- Check which data sources you are using and make them consistent across the team. Ask your key suppliers what they use.
- Run a simple test: if the market contracts by 5 percent, what does that mean for your SOM?
Leave a Reply